What does it cost to live in Historic Bethlehem?

I’m Diana Hodgson. Join me as I tour a wonderful place to visit and a truly special place to live – Historic Downtown Bethlehem.

The center of the historic district is the original Historic Moravian Bethlehem which dates to 1714.  This part of town has been designated a National Historic Landmark District by the National Park Service.  The historic buildings cover an approximate 14 acre area near Main and Church Streets.  The German Colonial architecture is glorious.  Buildings like the Central Moravian Church,  the Gemeinhaus,  the Colonial Industrial Quarter, the Sister’s house are buildings of cultural significance.  They are in beautiful condition and have been lovingly cared for.

Our vibrant Main Street is the heartbeat of the city.  Visitors from all over the world come to learn about the history of Bethlehem, visit the independent retailers on Main Street,  and enjoy dining at an array of popular restaurants and bars. 

It is important to note that the businesses throughout our downtown are locally and independently owned.  You will not find national brands on Main Street.

The residential properties within the historic district are coveted.  Once a property is listed for sale within the historic district it doesn’t take long for it to sell.  Historic Bethlehem is a place where people want to live!

Within the last 22 months only 15 properties have changed hands.  The average price of a twin home in the Historic district presently, is approximately $380,000.  The average price of a single home in this neighborhood is approx. $710,000.  Within the last 22 months the prices range from $230,000 for a twin to a beautiful home in pristine condition for $1.2 million.  And compared to other parts of the city these prices are much higher.

Most houses have been selling within a week of going up for sale.  Many within a day.  But right now the average days on market for the last 22 months is 30 days.   

The architecture of this area is protected by the city through its Historic Architectural Review Board also known as HARB.  As a resident within the historic district you commit to keeping the exterior your home in its historic condition.  The attention to detail helps to keep values of these home consistent.  And because of their historic significance and the wonderful condition of the homes, this keeps the neighborhood in high demand. 

Historic Bethlehem is an integral part of the overall health of our community. It brings millions of visitors to our city throughout the year, and the revenue that is generated keeps our taxes low, and property values stable.

It is worth noting that our Historic District provides both psychological and educational benefits to our residents.  It creates a sense of community and belonging, and it helps illuminate the history of our city.

Please stay tuned for more of my neighborhood videos.  If you’d like to see the next neighborhood video, subscribe below.  When you are interested in Selling, Buying or investing in real estate here in the Lehigh Valley, we would love to be your real estate professional of choice.  You can reach me by calling 610-417-1174 or by emailing [email protected].  If you have a question about real estate or the Lehigh Valley please add it in the comment section below.

What’s selling and What’s not! – here in the Lehigh Valley

Today, I’m going to review the March 2020 Real Estate market reports for the Lehigh Valley. These numbers include the time that the Corona virus started in our area and when many of us were told to stay at home.

First thing to talk about is new listings that came on the market.  As you can see in 2019 there were 959 listings that came on to the market compared to the 722 of March 2020.  That resulted in a whopping -24.7% change!  What this mean to you as a home buyer is that there are less properties to look at in your price range and you have more competition with other active buyers looking to purchase.  As a seller this means that the market is ripe for your to LIST YOUR HOME WITH ME to get it sold.  As a seller you can count on having multiple offers if your house is in good condition and priced right.

Next up is closed sales or properties that have SOLD!  You see that the number for 2019 shows that 609 properties sold last year in March.  This year only 554 properties sold.  Which produced another change of -9.0%.  For both the buyer & seller this proves that inventory is low which has caused the numbers to drop.  This is not a good indication of the pandemic because the majority of these sales had been in the works about 45 days before they closed in march.

The next slide shows you the length of time that a house is on the market until it gets tagged as SOLD.  You’ll see that the days on market has decreased 20.4% to 43 days on market.  This time last year it was 54 days on market.  The number is a refection of  the lack of inventory and the level of competition.  There are a lot of buyer in the market with out enough inventory to choose from.  One tip that I would give a buyer is be sure that you’re pre-approved for a mortgage before you go looking.  You need to be ready to make an offer as quickly as you can and without a pre-approval you won’t be able to write an offer.

The average sales price has risen by 6.5% which is a great thing if you’re  a seller.  The new average is $238,350 up from 4223,812 last year.  As a buyer rising prices is just more proof that the market is hot and you have to make a decision quicker than later.  It also means that there isn’t much room for negotiation if prices are rising.

The next slide hasn’t changed much over the last 5 years.  The percentage of the list price received by a seller is now at 98.7%.  Over the last five years this number has always been in the 97+% range.  Good for sellers and a tough negotiation for buyers.  But there are

The next slide shows us that the inventory is shrinking.  This is a clear indication of the affect that the virus is having on the market.  Because we have had the shelter-in-place order and real estate is not considered essential at this point in time, many sellers have been sitting on the sideline which has resulted in the 36.5% reduction in inventory. 

The lack of inventory is told in another way….The months supply of inventory.  At this point in time we have 1.4 months supply of inventory if we continue to sell at the current rate.  The inventory is down by 41.7%.  In march of 2018 and 2019 we had 2.4 months supply.  This is another clear indication that the pandemic is having an effect on the real estate market.

If you are interested to know what your home is worth, please contact me today for your free consultation.  We can have our appointment virtually so that you don’t have to leave the house, but you’ll be able to get the information and answers that you’re looking for.

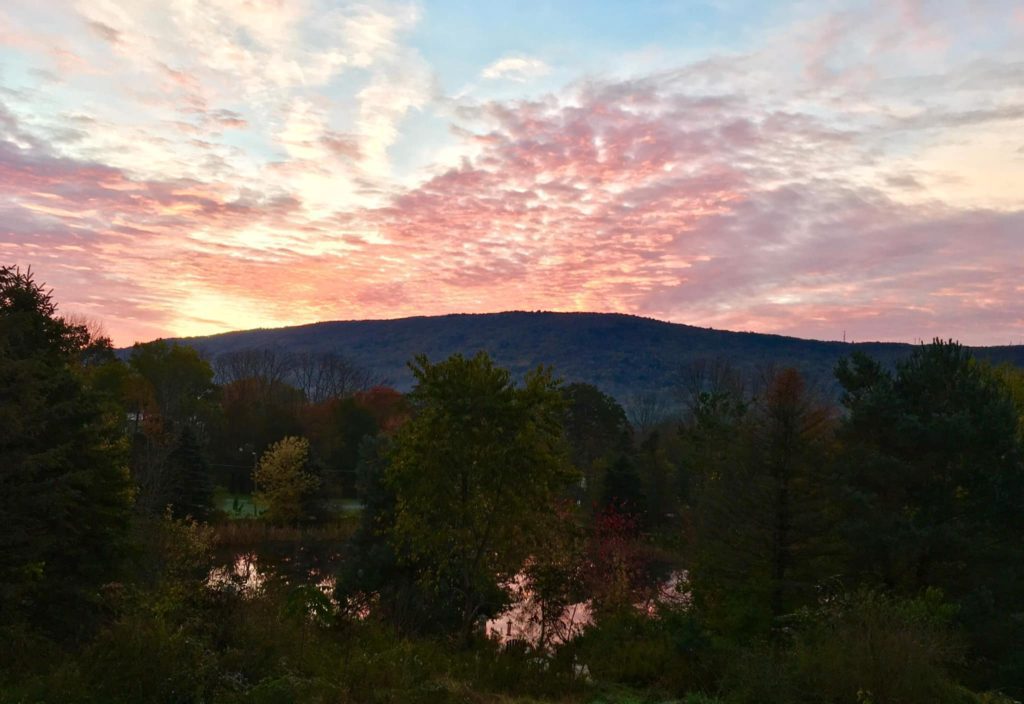
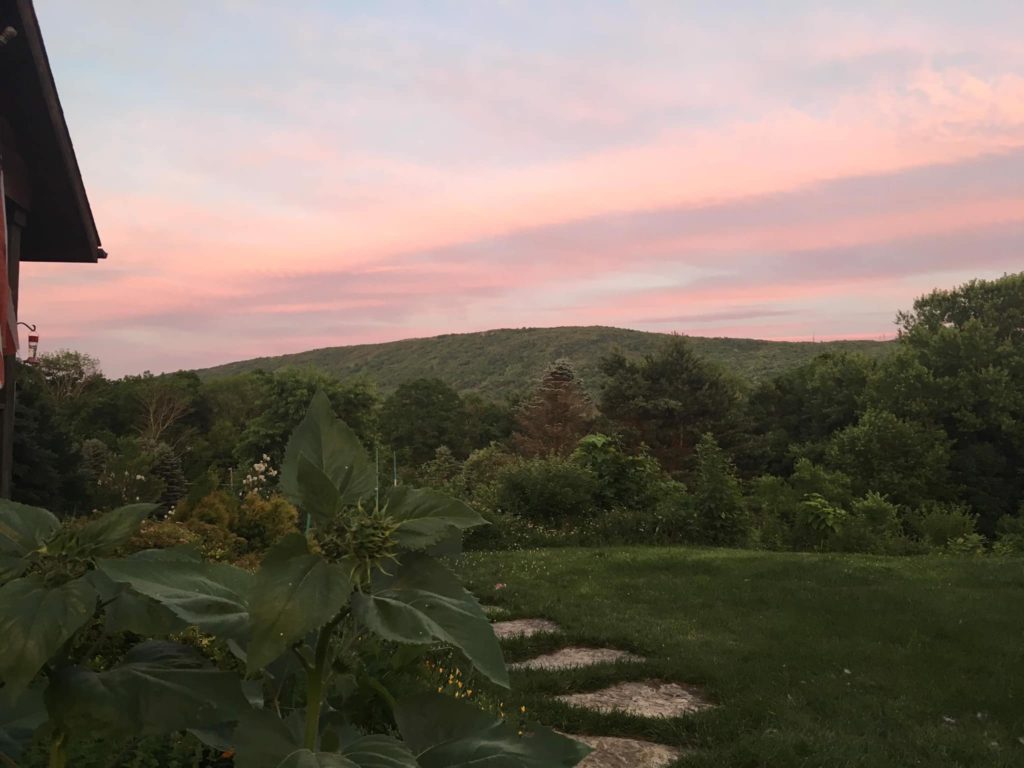
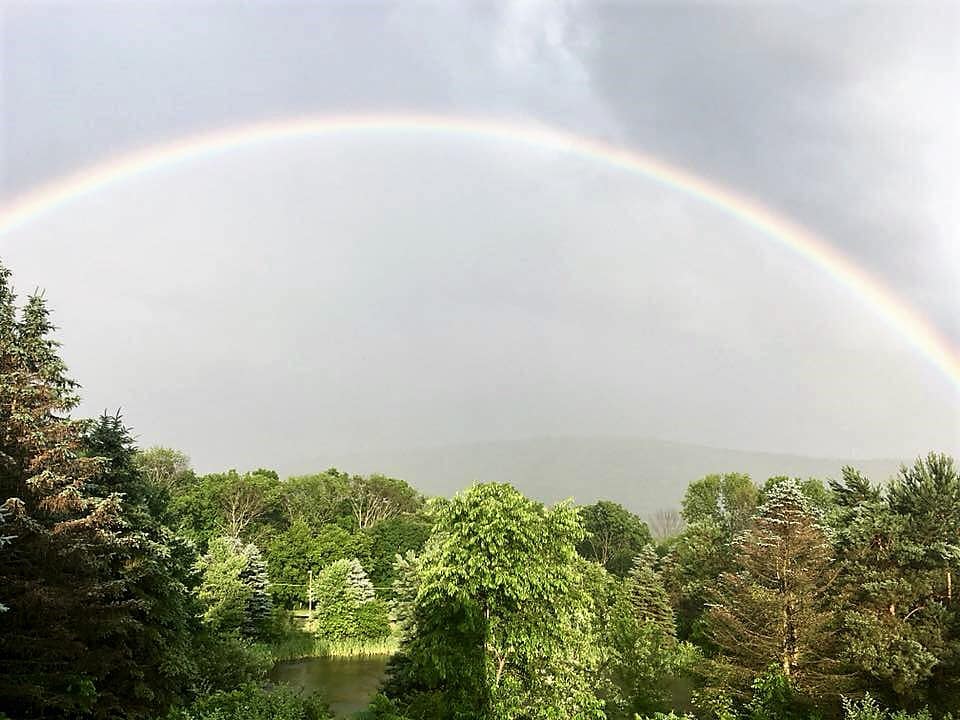
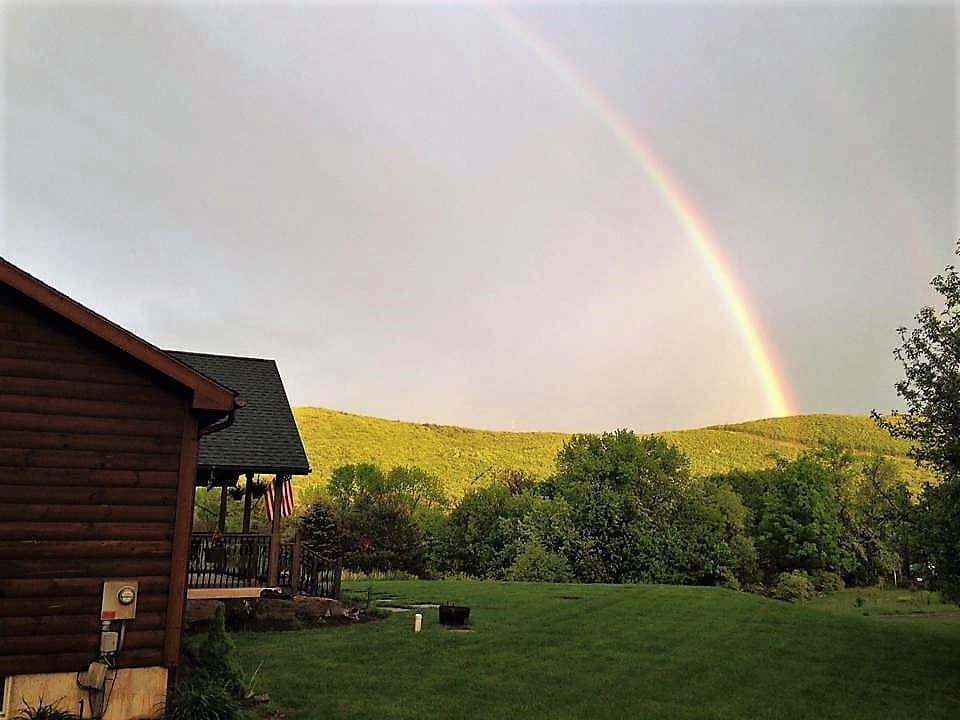
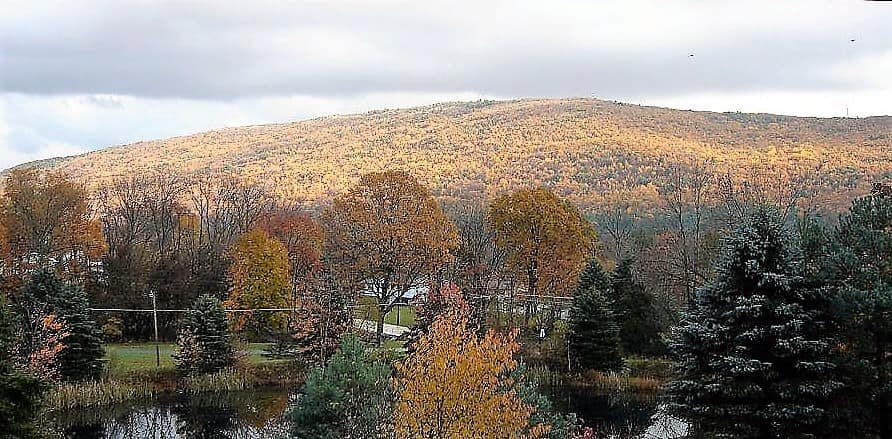
Spectacular seasonal views!

Enjoy the spectacular views from every window in this 3 Bedroom, 2 Bath Log Sided Ranch Style Home nestled on a 3.46 Acre Parcel  with its own Stocked Fishing Pond.

Enjoy entertaining in the large Family Room with its stunning wood burning Stone Fireplace, and Exposed Wood Beams on the ceiling. A large Galley Kitchen connects to the Dining Room with views of the mountains and pond, and Australian Cypress Hardwood Floors throughout the home. 
Full Basement, and a Oversized 2 Car Garage are just a few amenities this home has to offer!
The wood ducks are expected to return to the pond this Spring along with the other birds, frogs and fish.